Canada’s Express Entry system has continued in 2024, issuing invitations to apply to applicants from all three of its programs. Well, here’s discussing the present state of the Express Entry pool.
The composition of the candidate pool is a key factor in how the CRS cut-off scores, as well as the draw sizes, are determined under Express Entry. While it is very difficult to predict these two factors with certainty, newcomers might benefit by understanding the present state of the Express Entry pool, to better know what to expect.
How Does The Composition Of The Express Entry Applicant Pool Influence CRS & Draw Size
In addition to the present state of the Express Entry pool, it can be difficult to know exactly how the makeup of the Express Entry pool will impact CRS scores & draw sizes. Well, there are some general trends that can help newcomers better understand what to expect in upcoming draws.
Distribution Of Scores Impacts CRS Cut-Offs
The distribution of the scores within the pool might play a direct part in determining CRS cut-offs for upcoming draws. The basic logic here is that the spread of scores in the pool skews higher or lower depending on the addition or subtraction of profiles, the number of people invited in the previous draw, & the number of profiles that expire are no longer eligible to be considered for draws.
For instance, if there are a large number of people in the Express Entry pool from the CEC, then this might cause average CRS scores within the pool to increase, as the scoring criteria under the CRS tends to reward those with the previous Canadian work/ study experience more than other factors.
Category-Based Draws Can Also Influence The Spread Of Scores
In 2023, IRCC made substantial changes to the Express Entry program by creating immigration categories to better meet Canada’s labor market & demographic needs. Through the introduction of these category-based draws, applicants with specific professional experience or language proficiency that Canada needs can obtain ITAs via the Express Entry system, irrespective of their CRS scores.
IRCC has confirmed that they will maintain the same categories throughout 2024 that were implemented in 2023. These are:
- Healthcare
- STEM Professions
- Trades
- Transport
- French-Language Proficiency
- Agriculture/ Agri-Food
Immigration Levels Will Determine Draw Sizes & Limits Throughout The Year
While discussing the present state of the Express Entry pool, it is vital to note that every year, Canada publishes its updated immigration levels plan for the year ahead. This plan outlines the number of immigrants that the nation will welcome for the next three years from each of the four immigration classes, i.e., economic, family, refugee, & humanitarian.
In addition, Express Entry falls under the economic class – the single largest group of immigrants Canada welcomes annually. This year, Canada will welcome over 281,135 immigrants via economic streams, 110,770 of which will come via Express Entry-managed programs.
Thus far, IRCC has issued around 16,910 ITAs through Express Entry in 2024.
The Present State Of Express Entry Pool
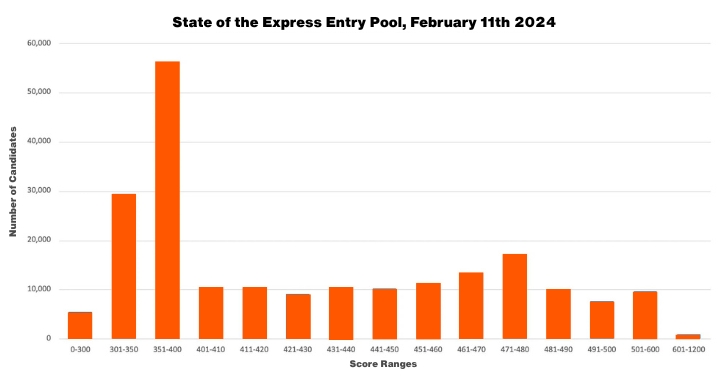
As of February 27th, 2024, there were over 211,487 applicants in the pool, with the largest section of them having CRS scores between 451-500. Despite this, more than 65% of applicants were below this score grouping, indicating that the Express Entry pool shows a wide range of CRS scores & applicants.
The following table shows the overall spread of scores in the pool according to the data given by IRCC.
| Score Ranges | Number Of Applicants |
| 351-400 | 56,178 |
| 301-350 | 29,305 |
| 471-480 | 17,137 |
| 461-470 | 13,373 |
| 451-460 | 11,192 |
| 431-440 | 10,474 |
| 401-410 | 10,439 |
| 411-420 | 10,407 |
| 441-450 | 10,265 |
| 481-490 | 10,095 |
| 501-600 | 9,567 |
| 421-430 | 9,110 |
| 491-500 | 7,574 |
| 0-300 | 5,406 |
| 601-1200 | 965 |
The graph similarly shows the spread, comparing the number of people in each score range:
Taking to the top of each score range, we can even compare what percentile each score would put an applicant in. Though this again cannot be said with certainty if one obtains an ITA, it is a key indication as to how a score stacks up in the present makeup of the Express Entry pool.
| Score | Percentile Rating |
| 1200 | 100.00 |
| 600 | 99.54 |
| 500 | 95.02 |
| 490 | 91.44 |
| 480 | 86.67 |
| 470 | 78.56 |
| 460 | 72.24 |
| 450 | 66.95 |
| 440 | 62.09 |
| 430 | 57.14 |
| 420 | 52.83 |
| 410 | 47.91 |
| 400 | 42.98 |
| 350 | 16.41 |
| 300 | 2.56 |